




Home ESS Payback Period: When Does It Pay Back?
A home ESS payback period is the time needed for bill savings, export-credit gains, and outage-cost avoidance to recover the net installed cost. In 2026, payback can be fast in high-rate or weak-grid regions, but slow in flat-rate areas with rare outages. The safest calculation uses your quote, utility rate spread, backup value, export rules, and usable battery capacity.
A home energy storage system can lower electricity bills, support backup power, and improve solar self-consumption. But it only pays back well when the numbers fit your home. Before comparing battery brands or capacities, use a simple payback model to test whether the system has enough daily financial work to do. For a wider system overview, start with this home energy storage system guide.
What does home ESS payback period actually mean?
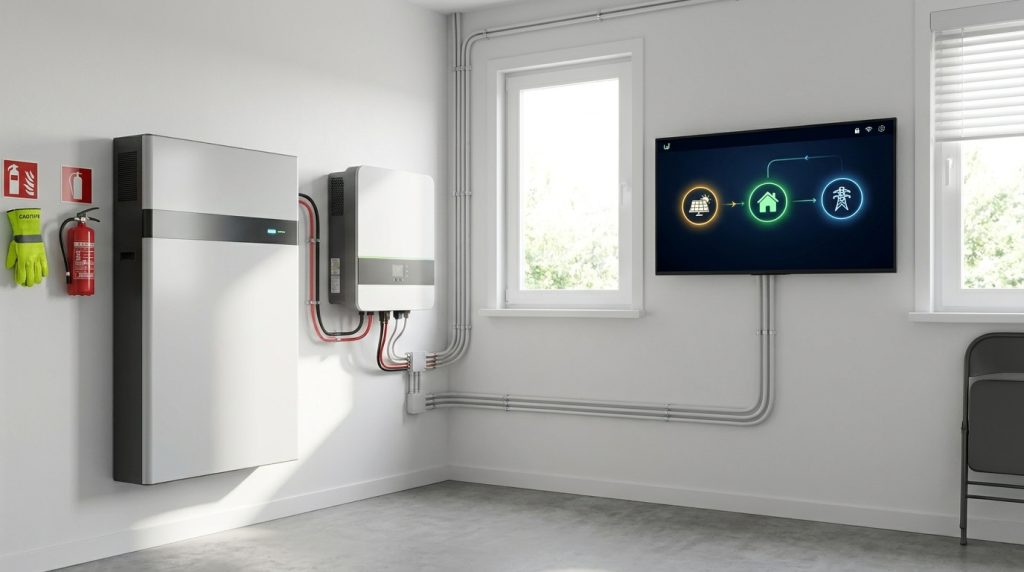
Home ESS payback period means the number of years required for energy savings, export credits, and outage-cost avoidance to recover the net installed system cost. It is a break-even measure, not a full lifetime profit model.
The basic formula is simple:
Payback period = Net installed cost ÷ Annual financial return
Net installed cost means the system price after verified rebates, tax credits, or other incentives. Annual financial return includes savings from time-of-use shifting, avoided export losses, and real outage costs that the battery helps prevent.
This is different from full lifetime return. A battery may break even in year 8, then keep producing value for several more years. It may also deliver backup value that does not show up cleanly on an electric bill. Treat payback as the first filter, then check warranty, usable capacity, and long-term performance.
What numbers do you need before calculating payback?
You need five numbers first: net installed cost, usable kWh, annual shifted energy, export credit value, and outage-cost value. Without those inputs, any home ESS payback estimate is only a sales guess.
Collect these numbers before accepting a quote or comparing systems:
| Input | What to check | Why it matters |
|---|---|---|
| Installed ESS cost | Battery, inverter, wiring, gateway, labor, permits | This is the starting cost to recover |
| Incentives | Verified local or federal credits | Incentives can reduce the net cost |
| Usable capacity | Battery capacity after depth-of-discharge limits | Nameplate kWh may not equal usable kWh |
| Daily shifted energy | kWh moved from low-value to high-value use | This drives bill savings |
| TOU rate spread | Peak rate minus off-peak rate | A wider spread improves arbitrage |
| Export credit | What the utility pays for exported energy | Low credits increase self-consumption value |
| Outage cost | Real yearly cost avoided by backup power | This matters in weak-grid areas |
| Maintenance or financing | Service, loan cost, replacement risk | These reduce true annual return |
For U.S. readers, incentive timing needs extra care in 2026. The IRS states that the Residential Clean Energy Credit applied to eligible property installed from 2022 through December 31, 2025, and is not available for property placed in service after that date. The same IRS page says eligible battery storage technology must have at least 3 kWh of capacity.
For sizing, do not start with the biggest battery. Start with load, outage target, and daily energy use. A simple battery sizing inputs review can prevent overspending before the ROI math even starts.
How does TOU arbitrage shorten the payback period?
TOU arbitrage shortens payback only when the peak and off-peak price spread is large enough after efficiency losses. If the spread is small or the home is on a flat rate, the battery may provide backup value but weak bill savings.
Time-of-use, or TOU, pricing charges different electricity rates at different times. A battery can charge from solar or lower-cost power, then discharge when grid power is expensive. The savings come from the price gap, not from the battery alone.
Use this simple formula:
Annual TOU savings = Daily shifted kWh × usable rate spread × 365
If a home shifts 8 kWh per day and the usable spread is $0.22 per kWh after efficiency loss, yearly TOU savings are about:
8 × $0.22 × 365 = $642 per year
A high-rate home with a strong evening peak can see useful savings. A flat-rate home may see little bill return, even with the same battery. That is why the rate plan matters as much as battery size. If the reader needs a basic system refresher, link the math back to battery storage basics.
Should outage cost avoidance count as payback?
Outage cost avoidance can count in payback when it replaces real costs such as generator fuel, spoiled food, lost work hours, or temporary accommodation. If outages are rare, treat backup power as resilience value, not guaranteed annual savings.
Backup power has real value, but it should not be forced into the ROI number. Count it when the battery prevents cash losses. Do not count comfort, peace of mind, or convenience as direct savings unless you label them separately.
| Situation | Count as financial return? | Example |
|---|---|---|
| Frequent food spoilage | Yes | Avoiding freezer loss after long outages |
| Remote work interruption | Yes | Avoiding missed paid work hours |
| Generator fuel replacement | Yes | Lower fuel and maintenance cost |
| Medical or critical loads | Partly | Count avoided direct costs, not emotional value |
| Rare short outages | Usually no | Treat as backup comfort |
A home ESS is not automatically a good ROI purchase. It works best when high rate spreads, low export value, frequent outages, or off-grid generator costs give the battery daily financial work.
Installation also affects backup value. A battery cannot protect the whole home unless the system, transfer equipment, and critical-load panel are planned correctly. Use backup installation planning before assigning a high outage value to the system.
Do grid-export credits help or hurt the ROI?
Grid-export credits help payback when the credit is strong, but low export rates often make battery self-consumption more valuable. Compare what you earn exporting one kWh with what you avoid paying by using it later.
Export credits are payments or bill credits for sending extra solar power to the grid. If the utility pays close to the retail electricity rate, exporting may already be valuable. If the export credit is low, storing that energy and using it later can improve the return.
| Grid rule | Better use of solar energy | ROI effect |
|---|---|---|
| High export credit | Export may still work well | Battery payback can be slower |
| Low export credit | Store and use later | Battery payback may improve |
| Strong TOU peak rate | Discharge during peak hours | Higher annual return |
| Flat retail rate | Backup may matter more | Bill savings may be weak |
The buyer should compare two numbers: export value and avoided purchase value. If exported solar earns $0.06 per kWh but evening grid power costs $0.35 per kWh, self-consumption has a clear financial case.
Different systems handle this in different ways. Some prioritize backup, some focus on rate shifting, and some work best with hybrid solar. Review storage solution options before choosing the control strategy.
What is a realistic 2026 payback in different regions?
A realistic 2026 payback depends on local rates, export rules, outage costs, verified incentives, and system size. The same 10 kWh usable battery can look strong in one region and weak in another.
Use these as worked examples, not universal averages. The EIA reported February 2026 U.S. residential average revenue of 17.65 cents per kWh, which is a useful reference point for a moderate-rate case.
| Scenario | Sample net ESS cost | Main return path | Example annual return | Simple payback | Decision note |
|---|---|---|---|---|---|
| High-rate grid state | $10,000 | TOU savings plus some outage value | $1,450 | 6.9 years | Works if the battery cycles often |
| Moderate-rate state | $10,000 | Limited TOU savings plus backup | $850 | 11.8 years | Needs careful sizing |
| Off-grid or weak-grid home | $12,000 | Generator fuel and downtime avoidance | $1,900 | 6.3 years | Strong when outages or fuel costs are high |
High-rate grid example
Assume a home shifts 9 kWh per day and the usable TOU spread is $0.28 per kWh after efficiency loss. Annual bill savings are about 9 × $0.28 × 365 = $920. Add $530 in real outage-cost avoidance, and the annual return becomes $1,450. A $10,000 net system pays back in about 6.9 years.
Moderate-rate grid example
Assume a home shifts 7 kWh per day at a usable spread of $0.16 per kWh. Annual TOU savings are about 7 × $0.16 × 365 = $409. Add $441 for backup value and export improvement, and the annual return becomes $850. A $10,000 net system pays back in about 11.8 years.
Off-grid or weak-grid example
Assume a rural home uses battery storage to reduce generator use, fuel trips, and work disruption. If avoided generator and outage costs total $1,900 per year, a $12,000 net system pays back in about 6.3 years. The writer or buyer must state the generator-cost assumption clearly.
For U.S. projects, do not add a federal credit unless the installation timing and eligibility are verified. The IRS explains that homeowners claim the credit for the tax year when the property is installed, using Form 5695. The DOE also provides a battery policies and incentives search that can help buyers check local programs.
Copyable home ESS payback worksheet

Use this worksheet before approving a home ESS quote. Replace the sample numbers with your own utility bill, installer quote, and outage-cost assumptions.
| Line item | Formula or input | Sample value |
|---|---|---|
| Installed ESS price | Quote total | $14,000 |
| Verified rebates or credits | Confirmed only | $4,000 |
| Net installed cost | Price minus incentives | $10,000 |
| Usable battery capacity | Installer spec | 10 kWh |
| Daily shifted energy | Your expected battery use | 8 kWh/day |
| Peak rate | Utility bill | $0.42/kWh |
| Off-peak or export value | Utility bill or tariff | $0.16/kWh |
| Usable rate spread | Peak minus off-peak, adjusted | $0.22/kWh |
| Annual TOU savings | 8 × $0.22 × 365 | $642 |
| Export-credit improvement | Your estimate | $250 |
| Outage-cost avoidance | Real avoided yearly cost | $500 |
| Maintenance or financing cost | Annual cost | $100 |
| Annual financial return | Savings plus value minus costs | $1,292 |
| Payback period | $10,000 ÷ $1,292 | 7.7 years |
A bigger battery is not always better. It works when the extra capacity cycles often, but a smaller battery is safer when evening loads are modest.
For example, a 10 kWh usable battery that cycles daily may shift 8 kWh per day. A 20 kWh usable battery may cost much more but only half-cycle in the same home. If the extra capacity sits unused most days, the larger system can have worse payback.
Before increasing battery size, right-size the battery around actual loads, outage goals, and rate spread.
When does a home ESS not pay back fast enough?
A home ESS may not pay back quickly if electricity rates are low, TOU spread is small, outages are rare, or the battery is oversized. In those cases, smaller storage, solar-only upgrades, or efficiency improvements may be the better first purchase.
Storage should solve a real energy problem. If the home has flat electricity pricing, strong export credits, and few outages, the battery may add comfort without strong financial return. That does not make it useless, but it changes the buying reason.
Watch for these warning signs:
- The battery will not cycle most days.
- The utility has little or no TOU rate spread.
- Export credits are already generous.
- Outages are short and rare.
- The quote assumes incentives that are not verified.
- The system is sized for rare worst-case loads.
- Financing cost removes most yearly savings.
This is where buyer discipline matters. Do not buy more battery than the home can use. If full ESS payback is weak, compare smaller backup storage, hybrid solar upgrades, or basic efficiency work first. A side-by-side review can help you compare storage choices before committing.
What should buyers ask before approving a quote?
Ask the supplier to show the payback calculation line by line. A serious quote should explain usable capacity, rate assumptions, export-credit logic, backup scope, warranty terms, and incentive timing.
Use this checklist during review:
- What is the usable battery capacity after depth-of-discharge limits?
- How many kWh will the system shift on a normal day?
- Which TOU plan or export rule is used in the calculation?
- Are incentives verified for the installation year?
- What costs are included in the installed price?
- What loads will run during an outage?
- How is battery degradation handled in the estimate?
- What happens if export-credit rules change?
- Is the payback based on cash purchase or financing?
A good procurement review should also run a no-incentive version of the calculation. This is especially important in 2026, since incentive timing can change the result. If the no-incentive case is still acceptable, the project is much safer.
What to Do Next
The best home ESS payback period is not the shortest number on a sales sheet. It is the result that still makes sense after you test real utility rates, usable capacity, export value, outage cost, installation scope, and incentive timing.
Start with your electric bill and one complete quote. Fill out the worksheet, then run three versions: optimistic, realistic, and conservative. If the system only works under the optimistic case, pause and resize. If it still works under the conservative case, the ESS is much easier to approve.
Frequently Asked Questions
What is the payback period of a solar battery?
The payback period is the time it takes for battery-related savings and credits to recover the installed battery cost. For a home ESS, calculate it from net cost divided by annual TOU savings, export-credit gains, and outage-cost avoidance.
Is it better to get a bigger battery to improve my payback?
Not always. A bigger battery improves payback only if you use the extra capacity often enough to create more savings, export value, or backup value. Oversizing increases upfront cost and can make payback slower.
Does this calculation account for battery degradation over time?
A simple payback calculation usually does not fully account for degradation. For a more realistic estimate, reduce annual usable energy slightly over time or run a second calculation using warranty capacity at year 10 or year 15.
Why does payback vary so much by location?
Payback varies because electricity rates, TOU spreads, export credits, outage frequency, incentives, and installation costs vary by market. The same battery can pay back faster in a high-rate or weak-grid area than in a flat-rate area with rare outages.
What electricity rate plan are you on?
Your rate plan matters because batteries save more when they shift energy from low-cost periods to high-cost periods. If your utility uses flat pricing, TOU arbitrage may be weak and backup value may become the main reason to buy.
How much do you value resiliency?
Resiliency matters when outages create real costs, such as food loss, work interruption, generator fuel, or temporary accommodation. If outages are rare and cheap to tolerate, count backup power separately from direct financial savings.

-

 OEM ODM Home Energy Storage Manufacturer for Stackable Home Battery Solutions
2026-08-20
-
 High-Rate Discharge in Data Center UPS Battery Backup Systems Explained
 -
 LiFePO₄ RV Battery 48V System Design: Battery, Inverter, Solar and DC Load Integration
2026-08-19
-
 51.2V LiFePO₄ Server Rack Batteries: 100Ah Capacity, Energy Output and Runtime
2026-08-18
-
 51.2V 100Ah LiFePO₄ Battery for Inverter in Solar Energy Storage Systems
2026-08-17
Share this:





.svg)






-899.svg)


